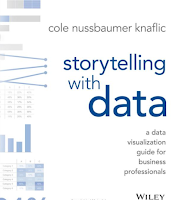
Book review - Storytelling With Data
Storytelling with Data: A data visualization guide for business professionals
Author: Cole Nussbaumer Knaflic
Author cred
If you’ve gone to HR conferences (pre-pandemic) or done any HR reading in the past few years, you’ll know about the effort that Google put into it’s people analytics function… largely to get data-based evidence for what makes their best leaders successful – called “Project Oxygen.”
Lots has been written about what they found, including Work Rules by Laszlo Bock, the head of HR at Google at the time. As Bock writes in the forward to Knaflic’s book, she was hired as an early and critical member of the people analytics team. Her success distilling “messy” data into clear and actionable information was exactly what was needed for their project; she was then tasked with developing a course to teach data visualization principles to the rest of the organization – and they put her on the road to deliver the content to Google business leads around the world.
She now blogs (storytellingwithdata.com), teaches workshops, and consults with other Silicon Valley clients who want to do better at analyzing and presenting data in a meaningful way.
Key ideas
- Context is key – Data visualization can be exploratory or explanatory. For the former, she recommends a different book – Data Points – which I will also look to purchase. 😊 Her focus in this book is the latter – using data to present ideas and prompt action.
- Describes the need to determine what you are trying to say before you figure out how to present it. Who is the audience, how will the information be shared, how much do they already know, what do you want them to do with the information? Once you have answered those questions, Knaflic explains how to boil things down to the 3-minute story and the “big idea” before you begin. She also describes the technique of storyboarding (and later in the book provides other approaches).
- Choosing how to display the data – she describes the top 5-10 charts she goes back to again and again, and what they are best used for, and makes the case for sticking with these. She shows variations, tips for drawing attention to specific data points, and provides references/links for more detail and templates for specific charts. She shows potential pitfalls of some of them, and describes logical ordering of the series in charts. She also explains her hatred and avoidance of pie charts generally. 😊
- Clean design = clear message – the next few chapters are about getting rid of clutter, applying visual design principles, using colour effectively, and how to focus your audience’s attention where you want it. She provides lots of good before-and-after examples.
- Storytelling principles – this chapter builds on the context chapter. All storytelling is about conflict, or about imbalance and how to restore balance. If you don’t have that, you need to consider whether you have the need to present anything at all. (I.e., the “all is rosy” story is not a story.) She describes the key elements of narrative structure and points to other resources for how to perfect PPT etc.. She also talks about the value of testing your narrative/story with friendly members of the audience or other neutral parties if you can.
- Case studies – she concludes with case studies that work through and illustrate the principles explained in earlier chapters. As with her earlier examples, everything she does can be produced in Excel (and she provides tips in some cases).
- Where to go from here – her final chapter talks about steps individuals can take to overhaul the data presented in their groups, and that organizations can take to build the data and storytelling competency.
Definitely a fast read/skim, and a book that I have gone back to again and again when working on an important presentation or report. I have since lost my copy (loaned it out, anyone?) and may need to pick up a replacement copy. I am open to recommendations for other books too!

Comments
Post a Comment